This section looks at trends for the following human settlement issues:
- population growth
- ecological footprint
- carbon footprint
- energy consumption
- solid waste
- transport
- water resource usage
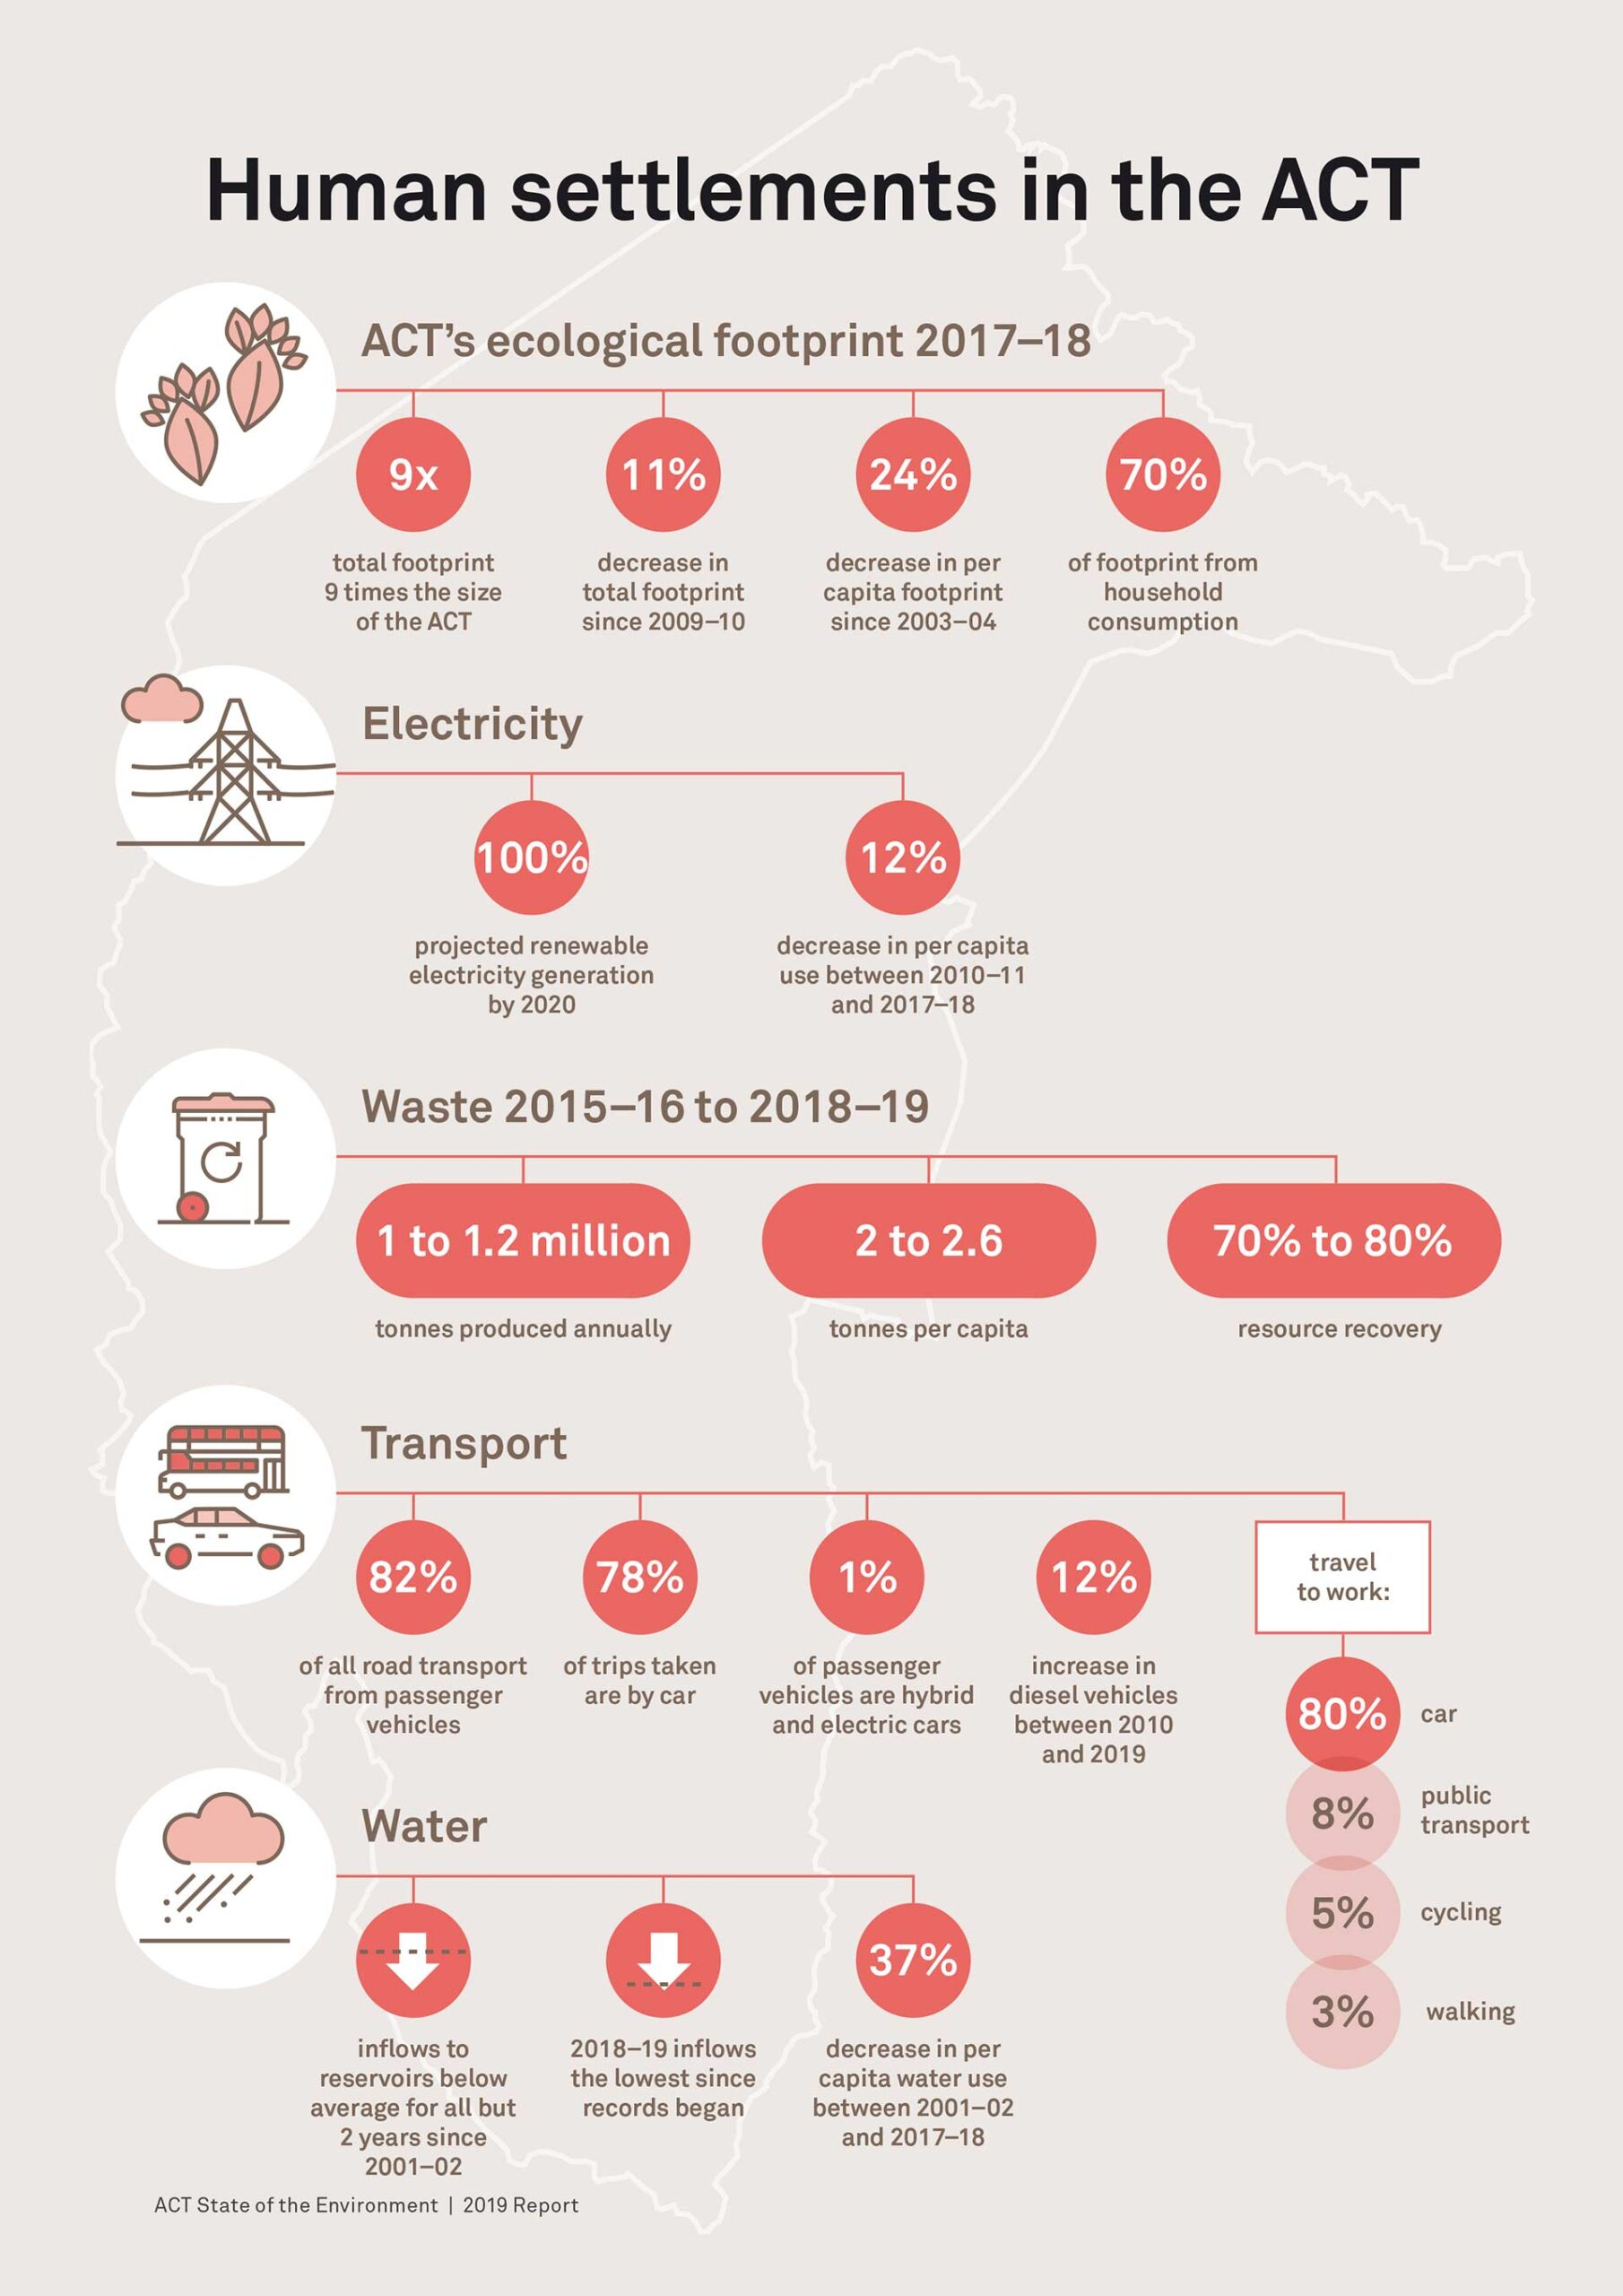
What are the main human settlement findings from the 2019 ACT State of the Environment Report? See the infographic and video below to find out.
Population growth
A growing population puts more pressure on the environment. With more people comes greater demand for energy and resources, increased waste, and development of land for industry, housing, and energy production.
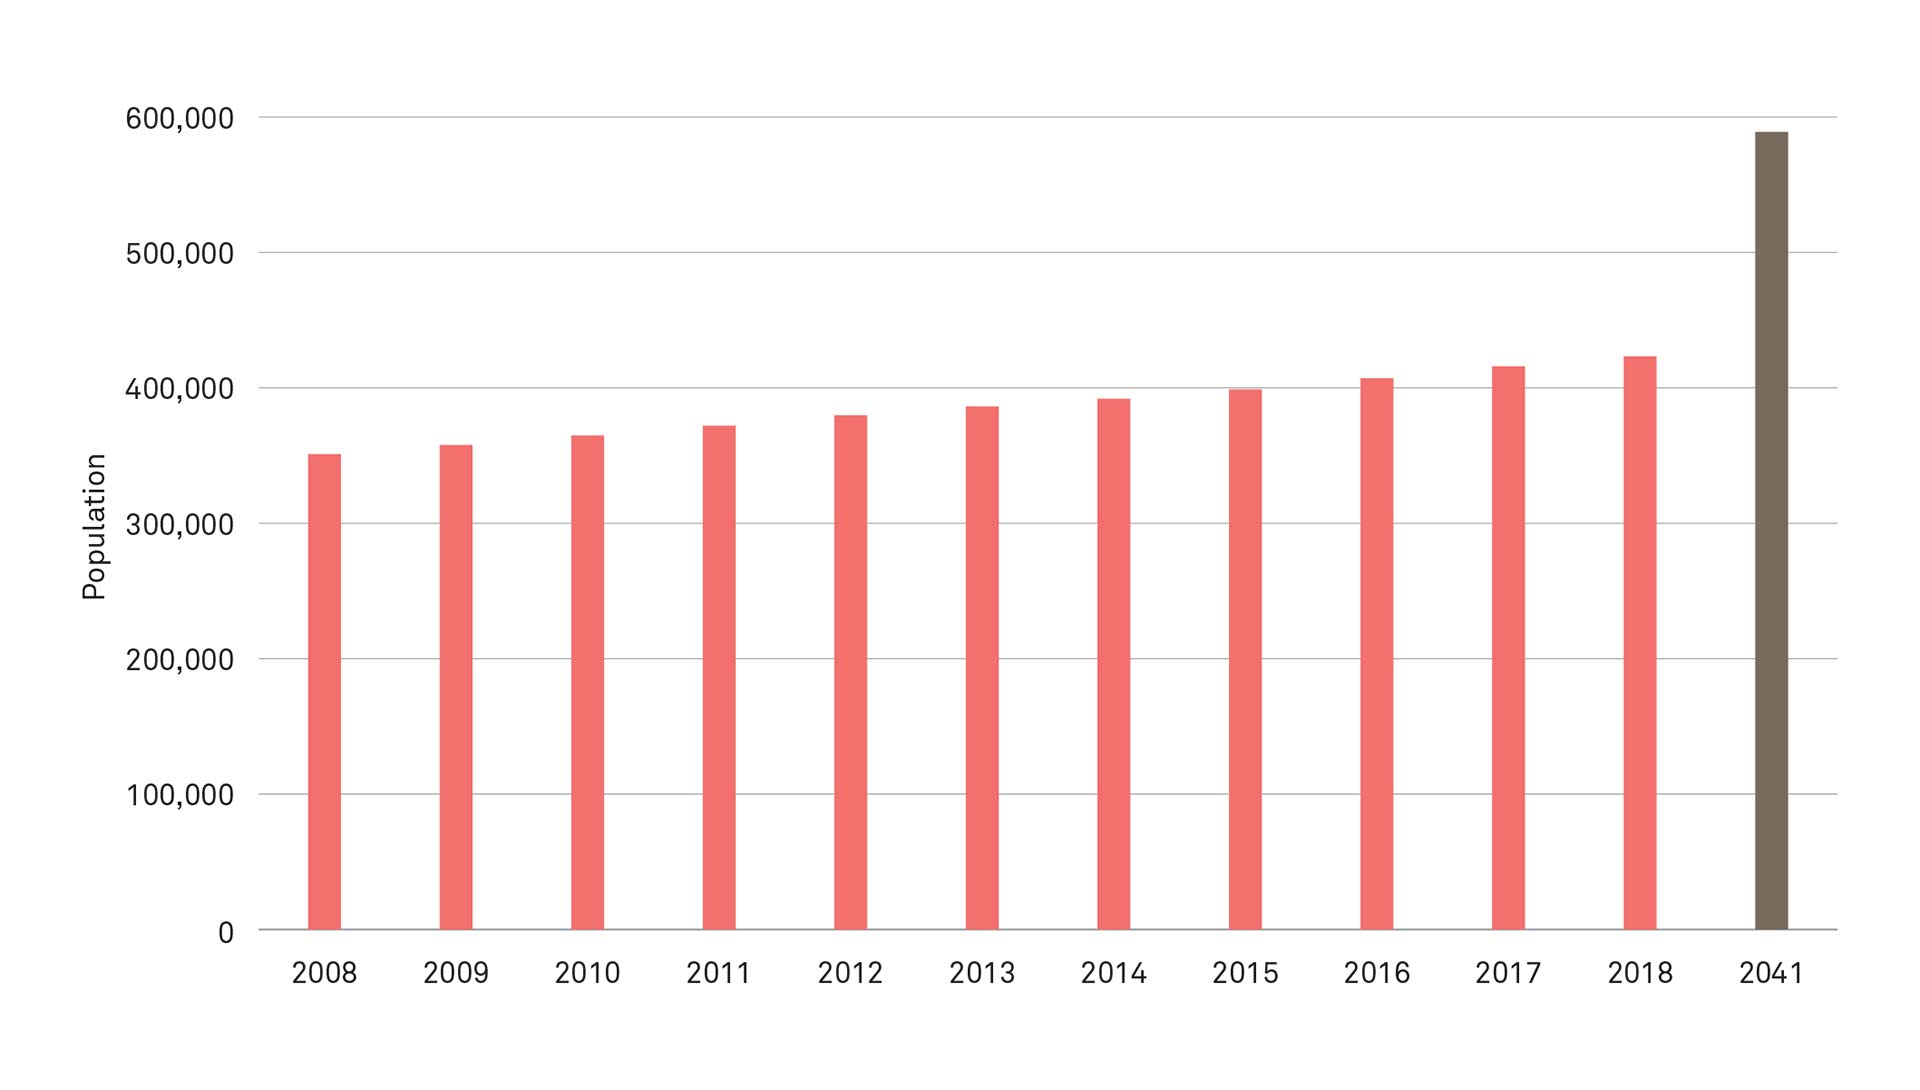
In 2018, the ACT’s population was approximately 423,000. The ACT has experienced strong and sustained population growth. Between 2008 and 2018, the population grew by approximately 72,000, an average annual increase of 7,200 people, or 1.7 per cent, per year.
Districts with the highest population include Belconnen (24 per cent), Tuggeranong (21 per cent), Central Canberra (20 per cent) and Gungahlin (18 per cent).
Areas of the ACT experiencing the highest population growth include Gungahlin, which accounted for more than half (around 39,000 people) of the total growth over the decade to 2016, and Belconnen and North Canberra, which both grew by around 11,000 people over the decade.
The ACT’s population is projected to increase to around 589,000 people by 2041.
Ecological footprint
An ecological footprintThe amount of land and water needed to supply the resources More is the amount of land and water needed to supply the resources (the food, shelter, energy, goods, services and other needs) consumed by an individual or group of people, and to absorb their wastes and emissions.
Changes in the ecological footprintThe amount of land and water needed to supply the resources More show the effect our daily activities and resource consumption have on the environment.
What are the main ecological footprintThe amount of land and water needed to supply the resources More findings from the 2019 ACT State of the Environment Report? See the video below to find out.
In 2017–18, the total ecological footprintThe amount of land and water needed to supply the resources More for the ACT was around 2.19 million hectares, representing over nine times the size of the ACT. That means that the ACT needs an area nine times its size to provide the resources, goods and services it requires, and to regulate its pollution. This resource use is unsustainable, placing stress on the rest of the Earth’s natural ecosystemsA collection of interacting living and non-living things. A More.
The ACT’s total ecological footprintThe amount of land and water needed to supply the resources More peaked in 2009–10 at just under 2.45 million hectares. Since then, the footprint has decreased despite the ACT’s population rising. So, the ACT’s per person footprint has fallen by nearly a quarter (from 6.9 hectares per person in 2003–04 to 5.24 hectares in 2017–18). The decrease means that the ACT’s per person footprint is now about the same as that for the rest of Australia.
More than two-thirds of the ACT’s ecological footprintThe amount of land and water needed to supply the resources More is from what we do at home. Minimising the use of resources and generation of waste at home can significantly improve the environment.
The main contributor to the ACT’s ecological footprintThe amount of land and water needed to supply the resources More is our food. The average diet requires lots of land, because cows and other sources of meat usually need a lot of space to graze. Many people want to eat food out of season, which means transporting food long distances. Selecting more locally produced and alternative sources of protein with lower footprints could substantially reduce the total ecological footprintThe amount of land and water needed to supply the resources More of the ACT.
During the past decade, the contribution of energy use to the ACT footprint has fallen, reflecting the increased use of renewable energyEnergy produced from natural sources that are constantly rep More.

Carbon footprint
Our carbon footprintThe amount of carbon dioxide and other greenhouse gases rele More is the amount of carbon dioxide and other greenhouse gasesA gas in the atmosphere (such as carbon dioxide, methane and More released into the air as a result of our daily activities.
The ACT population was responsible for total greenhouse gasA gas in the atmosphere (such as carbon dioxide, methane and More emissions of approximately 5.93 million tonnes of carbon dioxide equivalentA measure of all greenhouse gases, including carbon dioxide, More (also called CO2-e) in 2017–18. This is a decrease of over 20 per cent from a peak of 7.45 million tonnes carbon dioxide equivalentA measure of all greenhouse gases, including carbon dioxide, More in 2009–10.
This fall in emissions has occurred despite population growth in the ACT. The ACT’s per capita Australian footprint is now 11 per cent lower than that of Australia.
Energy consumption
In 2015–16, just one-fifth of the ACT’s electricity came from renewable energyEnergy produced from natural sources that are constantly rep More sources. In 2020, the ACT will achieve 100 per cent renewable electricity, the first state or territory in Australia to do this.
Wind farms supply the majority of the ACT’s renewable electricity.
Regardless of the energy source, it is important to reduce energy use – higher energy demand means that more energy needs to be produced. Electricity demand in the ACT is relatively stable, despite population growth. This is because the average per-person consumption has dropped, in part due to more energy-efficient appliances.

Solid waste
When we throw things away they have to go somewhere. Generation of waste affects the environment, requires land for its disposal, and ongoing work to stop contamination and pollution.
Depending on how it is managed, waste can have environmental impacts, including:
- land-use change
- pollution
- degradation of ecosystemsA collection of interacting living and non-living things. A More
- biodiversityThe variety of all life and living processes in the environm More loss
- increased greenhouse gasA gas in the atmosphere (such as carbon dioxide, methane and More emissions
- contamination and pollution of soils, groundwater and waterways
- presence of hazardous substances
- impacts on human health
- increased demands on resources required to dispose of, and recycle, waste.
The more we consume, the more waste we create. Compared with manufacturing products from raw materials, recycling waste reduces the demand for resources, and saves energy and water.
We often take resources, such as metals, to make into products that we then use once and throw away. It is far better environmentally to eliminate waste by re-using, repairing and recycling products. So, once mined and processed, the metal would remain in a continually flowing loop; being part of a circular economy. A circular economy entails keeping resources in use for as long as possible, extracting the maximum value from them while in use, and then recovering and regenerating products and materials. Like many other parts of Australia, the ACT is considering the possibilities of the circular economy.
ACT waste trends
The annual total waste generated in the ACT between 2009–10 and 2018–19 ranged from 816,000 tonnes to 1.2 million tonnes. That’s between 2 and 2.6 tonnes for every person in the ACT. The good news is that more resources are reused and recycled rather than being sent to landfill, with most years recording a resource recovery rate of 70 per cent or more – that means 70 per cent of waste is not sent to landfill.
Household waste can contribute up to half of the total waste sent to landfill. This shows how important it is for everyone to reuse and recycle as much as possible in the home.
Transport
The environmental impacts from travel include air pollution, greenhouse gasA gas in the atmosphere (such as carbon dioxide, methane and More emissions, reliance on non-renewable fuels, noise, and land clearing and habitat loss when roads are built.
Car use
Cars are used for nearly 80 per of daily trips in the ACT and Queanbeyan region. Cars are less efficient than public transport at moving people and so have greater impacts on the environment. Increased use of private vehicles adds to congestion and travel times, and creates demand for new roads. This is why it’s important to use public and alternative forms of transport such as walking and cycling. It is also important that people purchase electric vehicles rather than those powered by petrol and diesel.

Not only do we use cars for most of our travel, the number of cars and their usage is also increasing. The number of registered vehicles in the ACT grew from around 253,000 vehicles in 2010, to over 304,000 in 2018, an increase of 20 per cent. Light commercial vehicles, including sports utility vehicles (SUVs), are being increasingly used for recreation. These large vehicles are more damaging to the environment, emitting more air pollutants due to higher fuel use.
In 2018, the ACT’s vehicles travelled a total of nearly 3,900 million kilometres. This represents an increase of about nine per cent since 2010.
More cars and kilometres travelled adds to congestion causing inconvenience and stress. Between 2002 and 2017, daily commute times in the ACT increased from an average of 31 minutes to 52 minutes (a 65 per cent increase), the highest increase of any Australian city. ACT commute times are now approaching those in other Australian cities.
The dependence on cars means that most of the ACT’s transport emissions (both greenhouse gasesA gas in the atmosphere (such as carbon dioxide, methane and More and other pollutants) come from passenger vehicles. This is because petrol is the dominant transport fuel in the ACT. But since 2010, the number of diesel-powered passenger vehicles has tripled in the ACT. This large increase is of concern as diesel engines emit more air pollutants than petrol engines.
Public and alternative transport
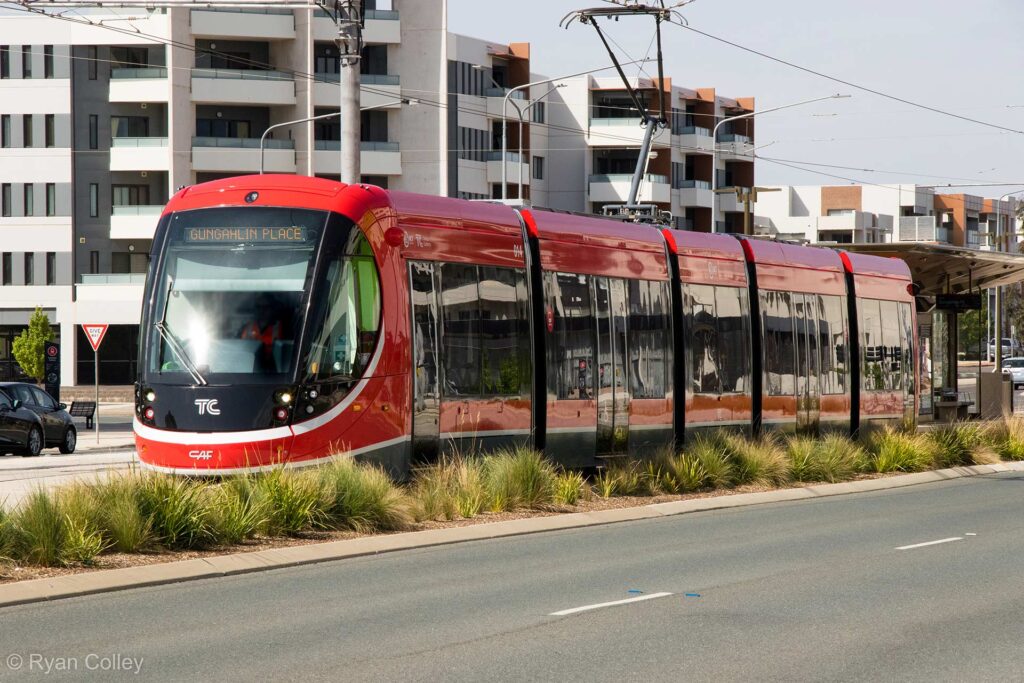
Although public transport use has increased in recent years, only four per cent of daily trips in the Canberra and Queanbeyan region are by bus. Canberra’s light rail began operating in April 2019 and will help to increase public transport uptake.
Only two per cent of daily trips in the Canberra and Queanbeyan region are by bicycle despite there being around 3,100 km of cycle paths and some 600 km of on-road cycling lanes.
Water resources
Water is vital for human health and wellbeing as well as the health of the ACT’s landscapes and urban environments. Homes, industry and agriculture need water (see Water section).
Water is a limited resource. We need to use water sustainably, especially as having adequate reserves is vital during periods of little rainfall. Climate change is likely to increase the frequency and severity of droughts and will affect the ACT’s water resources in the future (see Climate is changing section).
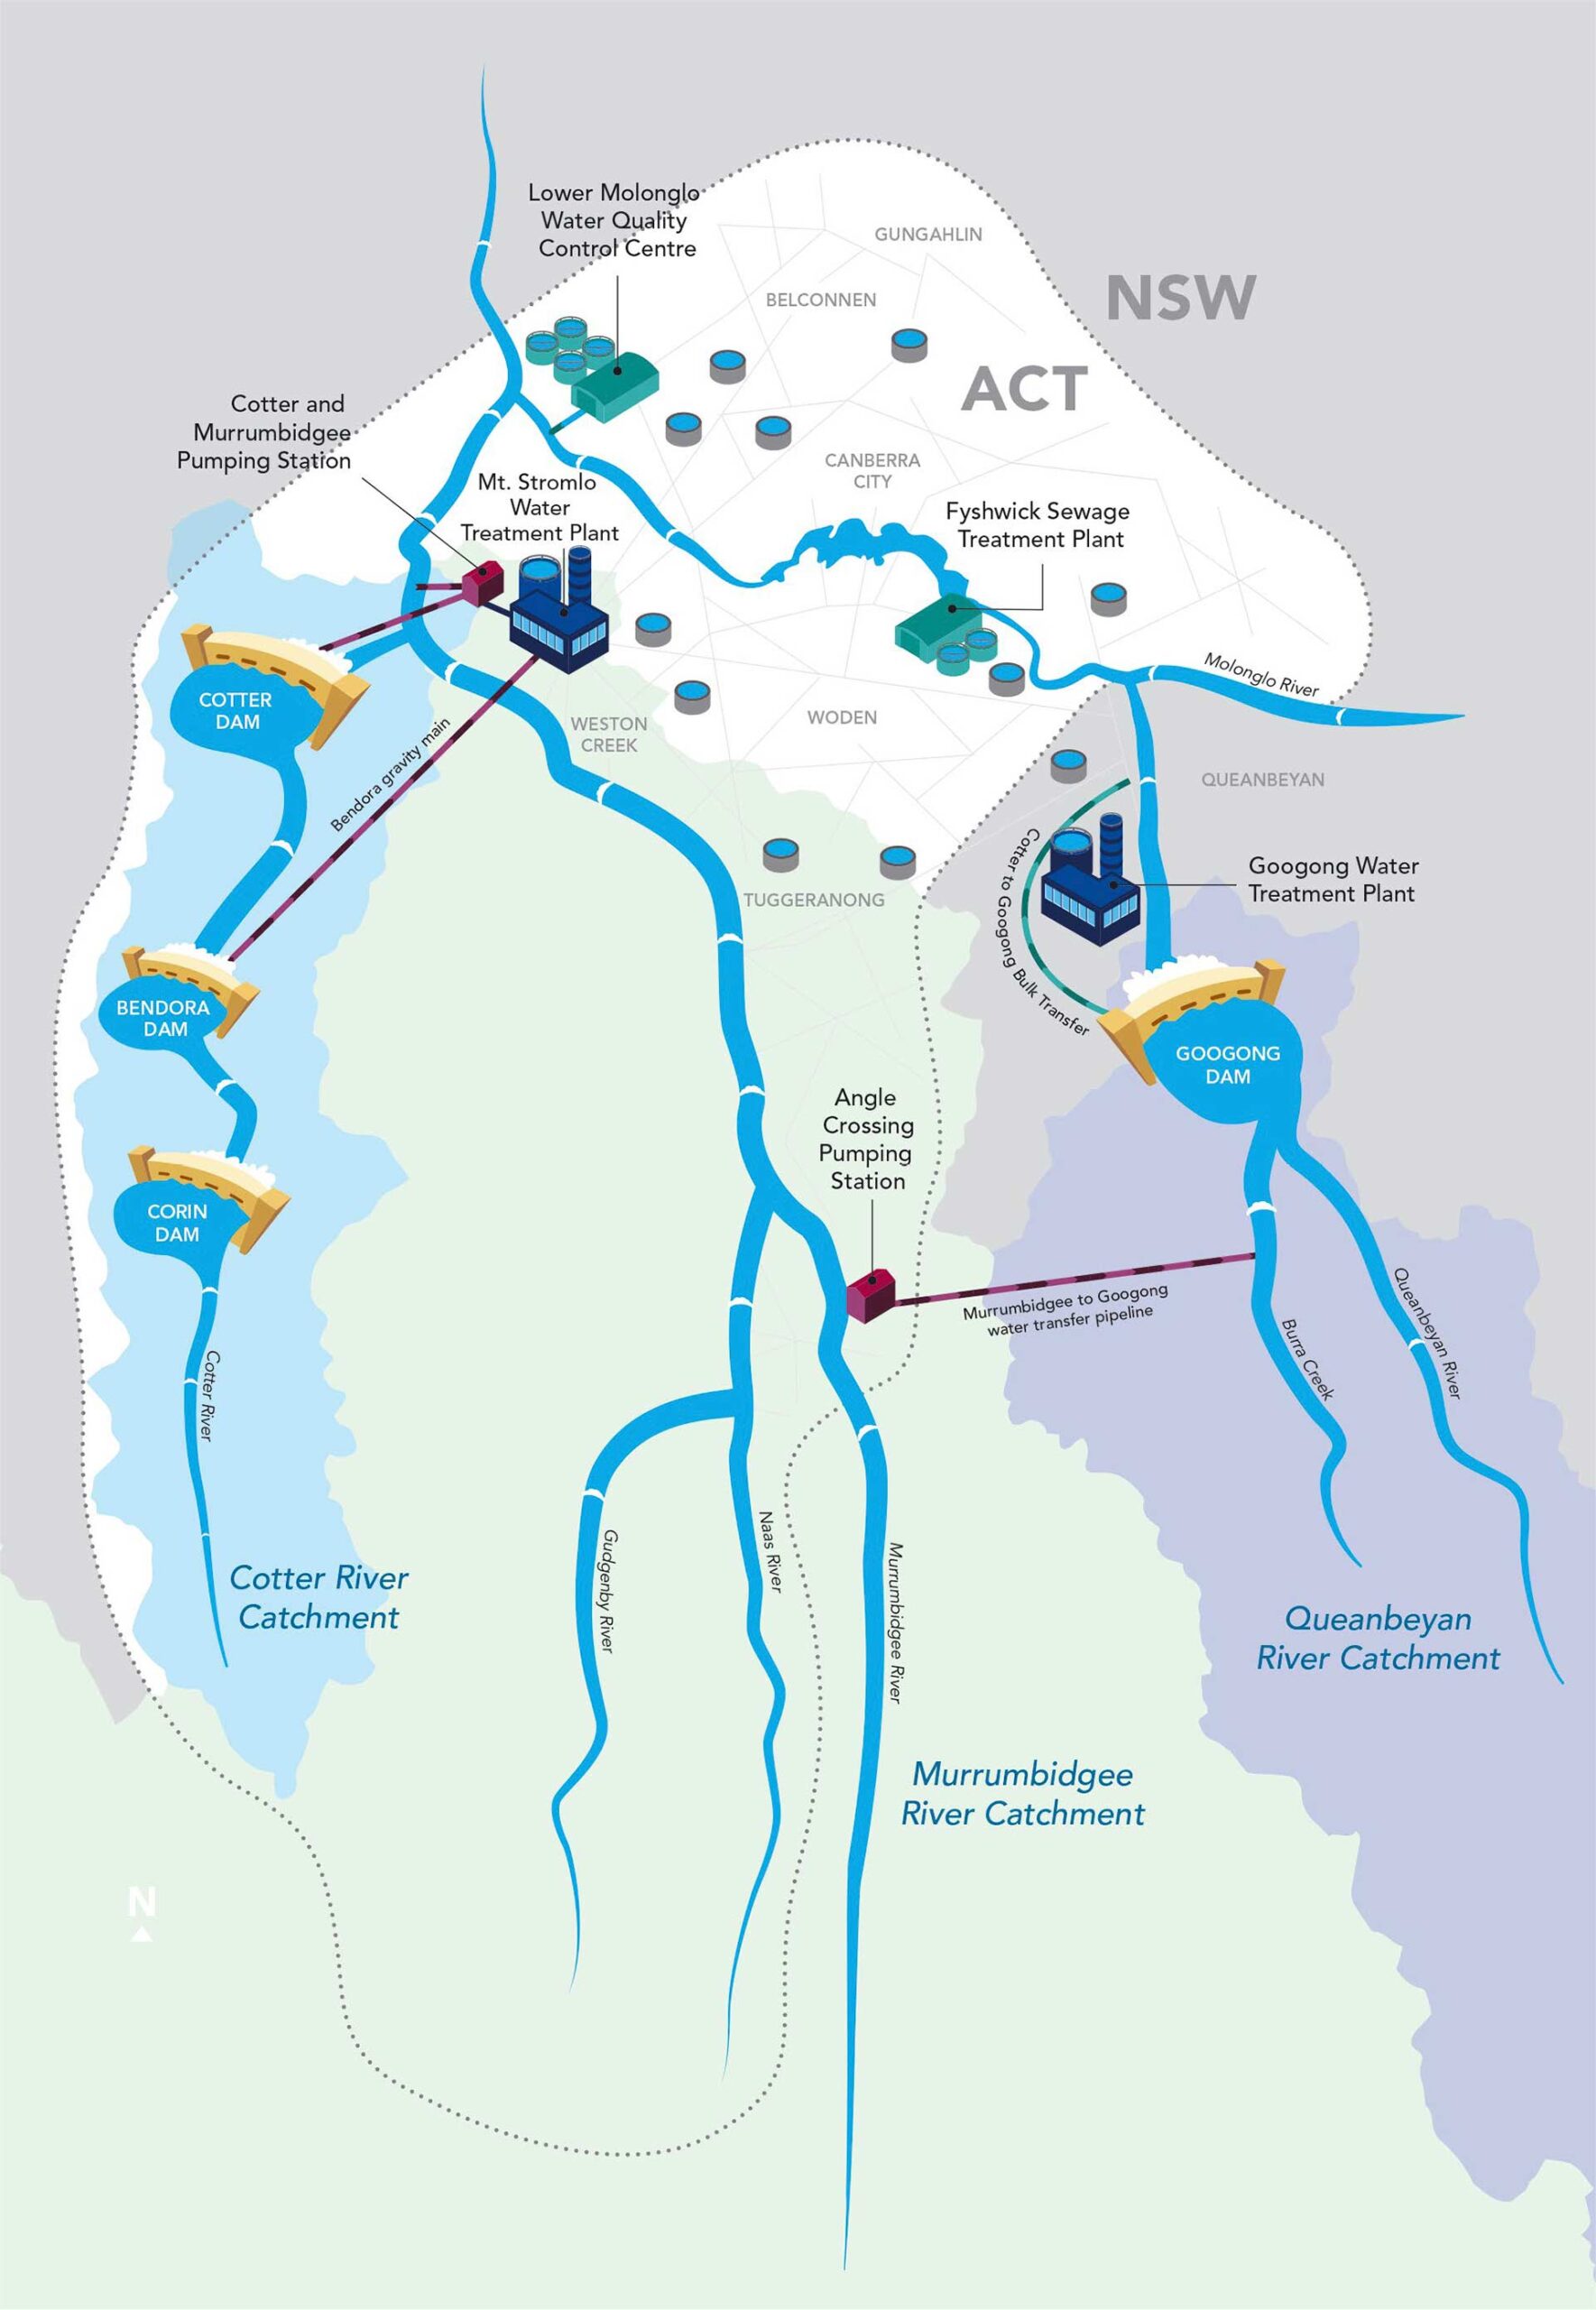
In response to the Millennium Drought, the storage capacity (how much water a dam can hold) of the Cotter Reservoir was increased to provide more water during long-term droughts.
The great majority of water used in the ACT comes from it’s four drinking water reservoirs. Only a small amount of water comes from groundwater and recycled water. Water recycling is largely dependent on the annual demand for such water and can also be affected by periods of high rainfall which can reduce the need for recycled water. There is currently low demand for recycled water in the ACT; however, if drought conditions continue, there may be a growing need for recycled water.
Water resource trends
Rainfall, temperature and evaporation all affect water availability. Stream flows in the ACT vary enormously. There can be years of dry conditions, followed by wet years that replenish water storages and river systems. This means that the ACT’s water resources are highly variable from year to year.
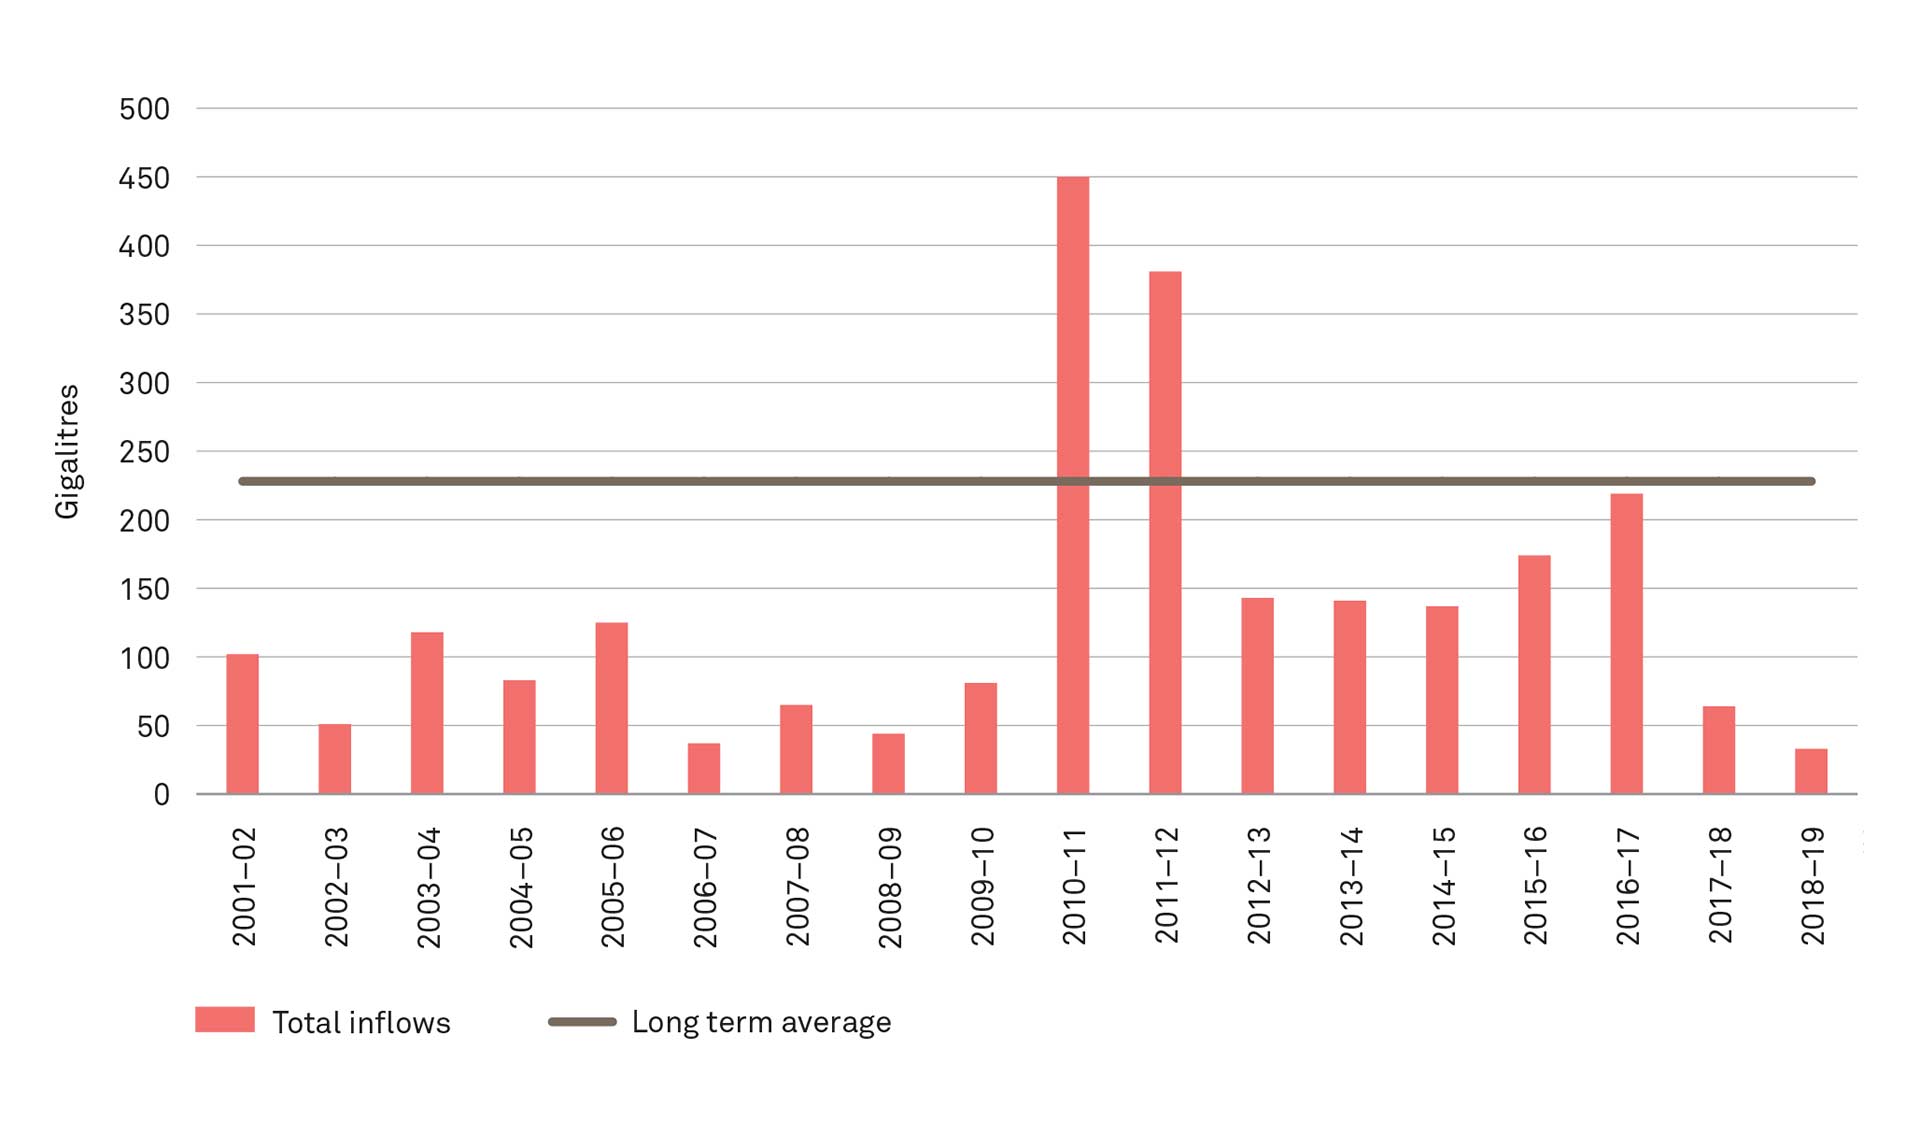
The most significant impact on the ACT’s water resources occurs during long drought periods. Between 2001–02 to 2018–19, inflows (water flowing into a reservoir) to the ACT’s four drinking supply reservoirs were below the long-term average for all but two years. And in 2018–19, total inflows were the lowest since records began in 1912, and nearly 90% below the long-term average. This means that water storage volumes have often been well below the long-term average since 2001. During periods of high rainfall, the ACT’s water resources are replenished, but the long-term trends in storage inflows show how vital it is to use water sustainably, even during high rainfall periods, to ensure good resources during dry times.
Water use
There are lots of things that influence water consumption, including population, changes in household usage, water restrictions, and changes in demand by businesses, industry and agriculture.
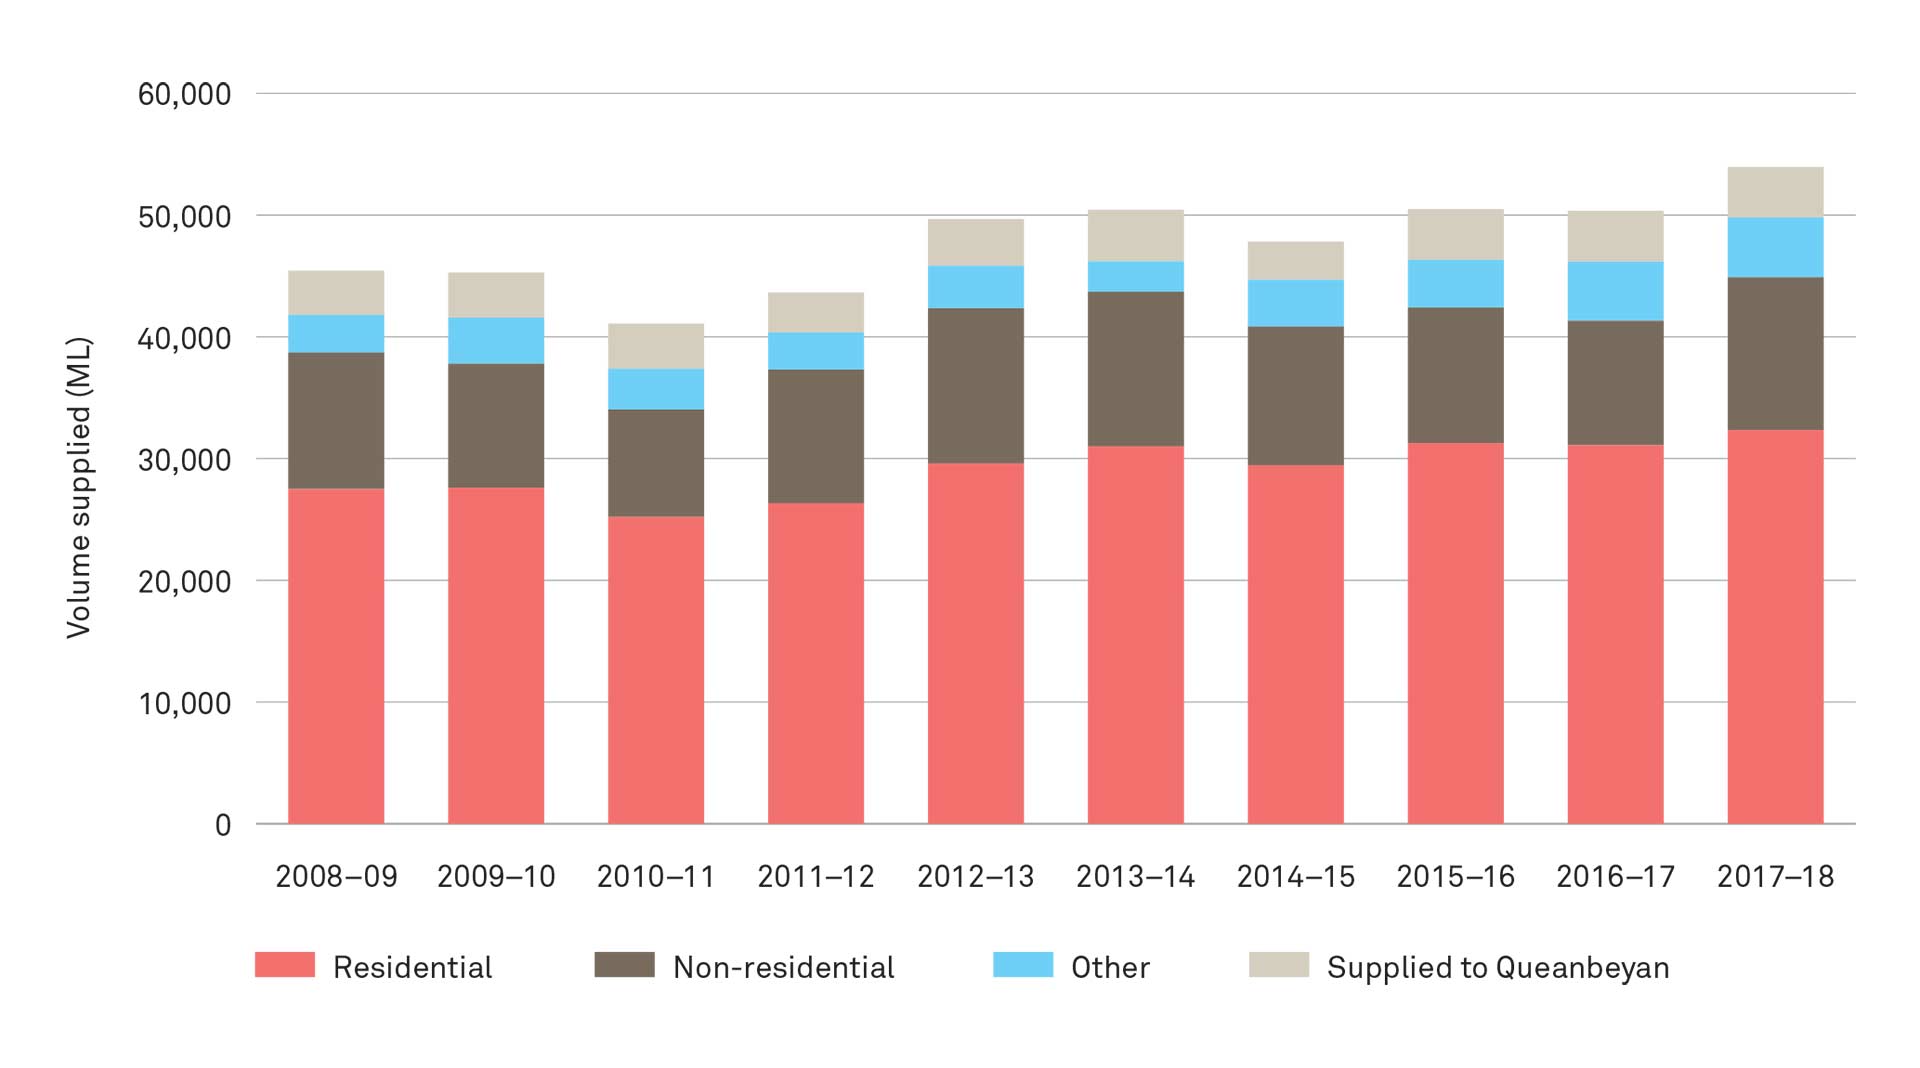
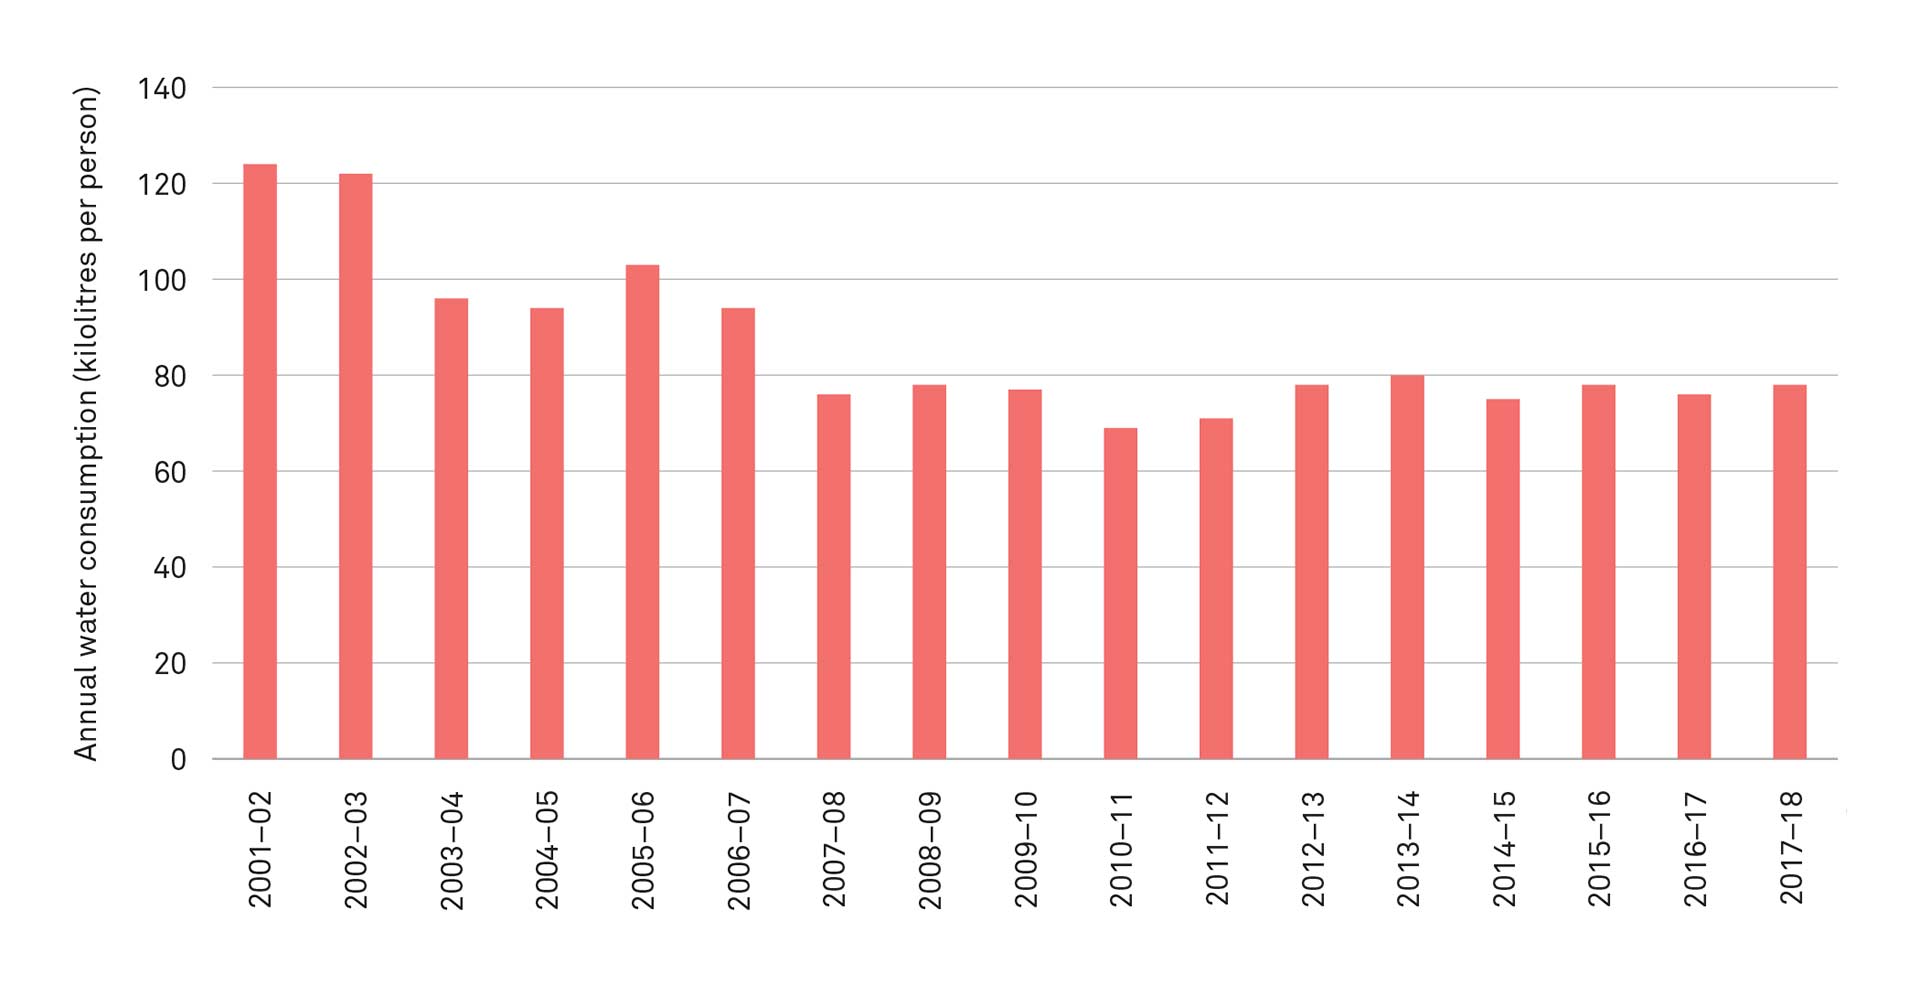
Consumption of potable (drinkable) water in the ACT and Queanbeyan has remained fairly consistent since 2012–13, at around 50,000 megalitres per year. During this time, the population has increased, meaning that water consumption per person has fallen. There are a number of reasons for this, including people becoming more aware of the need to save water during and since the Millennium Drought. Additionally, gardens are becoming smaller, and appliances are more water-efficient.
Around 60 per cent of the ACT’s water use is for homes. So, household water savings can have a big impact.